' {3 @" S$ U9 A3 Y6 [ `: Y5 b# [
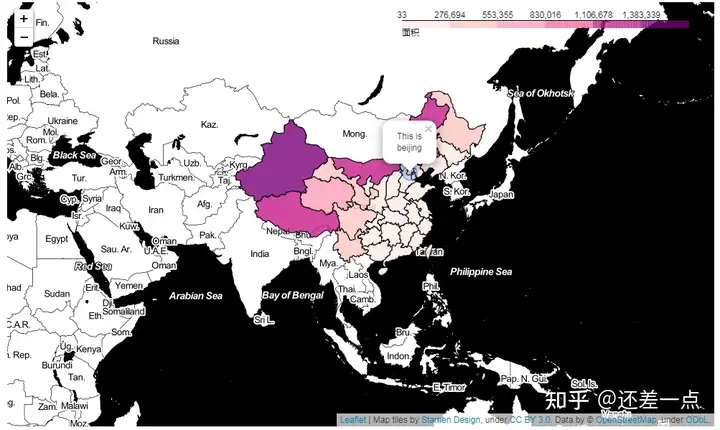
Choropleth зӯүеҖјзәҝеӣҫ1 A1 P' j: W( h+ C$ a' @
import pandas as pd #иҜ»еҸ–ж•°жҚ®
. k5 F' o6 z. U7 f) Z9 o from folium import Map,Choropleth,CircleMarker #з”ЁеҲ°зҡ„еҢ…8 w/ l- D: G9 w6 H5 ]3 ~
# ~/ T) N2 Y* \- a/ U) y J8 l #еҢ…еҗ«зңҒзҡ„дёӯеӣҪең°еӣҫjson9 c) M" G! b( `. U3 j
china_geo = fhttps://geo.datav.aliyun.com/areas_v2/bound/100000_full.json: U/ a% n7 `1 z3 ?8 s
#иҜ»еҸ–з”ЁеҲ°зҡ„йқўз§Ҝж•°жҚ®
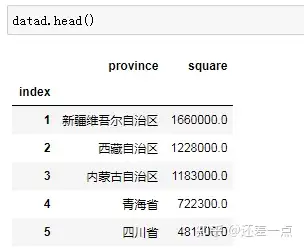
+ }. z& C* q4 o# U- D( O9 f$ ` datad = pd.read_csv(Desktop/square.csv,index_col=index)+ Y: {0 p4 J$ a2 K! ]) E. ]
4 J! }* y# w( [5 e& v
3 Y" S) C/ t( U3 b/ R% T m=Map(tiles=Stamen Toner) #ең°еӣҫйЈҺж ј! Y) J7 f- q7 C' D1 N
% Y) P5 M3 E* ~+ }2 P
Choropleth(china_geo, #йҖүжӢ©json6 G. ]# @; Q1 O1 d$ X
data = datad, #ж•°жҚ®+ K+ Q9 Y, W4 j ~; l# _
columns = [province,square], #еҲ—пјҢ第дёҖдёӘдёәkeyпјҢ第дәҢдёӘдёәvalue
. [, ~ U- |+ N9 ] key_on = feature.properties.name,#еҢ№й…ҚеҲ°json( f- _* q# t6 Q
fill_color = RdPu, #йўңиүІ
5 \3 J" S/ j8 j fill_opacity = 0.8, #еЎ«е……йҖҸжҳҺеәҰ9 B+ ^& {$ P6 L k) ]" |
line_opactity = 1, #зәҝйҖҸжҳҺеәҰ# I8 {5 j: L. D- ~4 O2 Y
line_weight = 1, #зәҝе®Ҫ
8 E. t( V; d. X. f legend_name = йқўз§Ҝ #еӣҫдҫӢ- p( N9 |5 p7 V7 j, \5 H1 K6 y
: f; ]/ i X @6 N# ~9 d
).add_to(m)
: [2 z- @/ U% K0 u7 l CircleMarker(location = [39.907518, 116.397514], #еқҗж ҮзӮ№
! N( }; R4 d7 Y: S& Y9 `, K* { radius = 10, #еҚҠеҫ„
* q4 T: H% N6 H fill = True, #еЎ«е……- e3 l1 ~* w& K* p' m/ c
popup = This is beijing, #еј№зӘ—
X; U$ J% w; Q: ^& C0 u weight = 1 #circlemarkerзәҝе®Ҫ
! Q* a: {# B2 t4 ? ).add_to(m)
; _6 N1 N: u/ N8 H. z7 m m.fit_bounds(m.get_bounds())5 {( P; I% G4 W) v0 e" ~5 z
m
7 `* F9 ]( ]- `, v! a+ w
1 C1 ]: O) w) n) j* o5 O- n( D - G! C6 \9 f3 I8 Q$ }
ж•°жҚ®ең°еқҖпјҡ square.rar - и“қеҘҸдә‘ % [7 s2 c# D; _7 x
дёӨдёӘйҮҚиҰҒзҡ„зҪ‘з«ҷ - M6 X( q3 u, {2 M$ ]5 Z6 Z
жүӢеҠЁз»ҳеҲ¶geojson / {2 J& r5 P, \8 [$ l# @$ Q, y$ _
2 E B, j/ t9 f3 ^& O
зӣ®еүҚжӣҙж–°зҡ„geojson
: K8 @$ s1 @8 R" [- \& B0 G # M9 `5 B4 s$ ]' f( o* s, w! L
geojsonж јејҸ
( A9 w, G/ T; C9 A! L8 O' T2 P {7 A0 ^; i% {% z& ?
"type": "FeatureCollection",
Z1 O! W- s6 {0 \0 h0 C: t% V1 W) L "features": [
9 K2 H. O4 I" k/ d( P; R6 w; } {. Z2 L4 I$ V9 N% w
"properties": {"name": "Alabama"},
; l }2 j7 }: Z2 V' G% ]4 y2 b+ o5 M# V "id": "AL",4 k% f% ] O& C C
"type": "Feature", x5 w* ?, v9 W9 O0 q5 c1 U
"geometry": {. o }! f" g- {0 K3 {% ?& H
"type": "Polygon",. O% R$ A8 J. j. A
"coordinates": [[[-87.359296, 35.00118], ...]]
3 n" L, Q! a) o' V. D4 y }1 l/ s! I' Y# `" i3 g: N( b
},% h4 A9 t/ K/ L; F- Q4 @
{
3 k1 R% o K( d8 L% Y! y "properties": {"name": "Alaska"},% m7 G+ y9 ^! q- t
"id": "AK",2 |$ X$ u1 \8 r( B
"type": "Feature",1 E& \8 n3 p" R/ \9 x5 l
"geometry": {
: ^% ^$ E8 G+ N( |% r: I "type": "MultiPolygon",
3 d2 L" M. o/ L! P! S "coordinates": [[[[-131.602021, 55.117982], ... ]]]
7 k1 s9 {/ b" W' l. H+ y: I, V }
! \2 A1 [) I& i& G+ B( ] },
1 s7 I) @) |9 U8 g0 T ]# }! g .... t) [, F# P6 B. E9 m3 z( `+ {
]
8 p, V1 J7 r+ o: z }
0 A/ y* K# N9 P9 c8 X ; {/ T4 q+ I: q7 V& S4 K, w, t* }
иҜ»еҸ–жң¬ең°зҡ„jsonж–Ү件 4 ]8 a' K3 q9 N1 f) x, l1 [
f = open(zhengzhou.json)
, W: p) @ `3 W( M t = json.load(f)9 `# W8 q8 j9 V
. [/ n2 |9 g% `7 b0 S иҜ»еҸ–зҪ‘з»ңjson 2 v/ i# g4 t" q$ j* m2 I: h
url = (
1 [/ S7 j) {+ b; \5 Y% @8 C6 ] "https://raw.githubusercontent.com/python-visualization/folium/master/examples/data"0 H& {3 ~9 O. F
)# ~/ i: T! u' \: C- R+ ~# [7 U
us_states = f"{url}/us-states.json"7 A& y2 }# i& b5 `+ ?0 R
( j- N: S: Q% a0 ? geo_json_data = json.loads(requests.get(us_states).text)) E3 @% ^* Z( s0 {+ K+ l
3 ^, `/ a1 F% l' x4 |8 {0 }
' ^" j% h8 P, ^3 d& R; J$ h% I v0 c: d3 q1 g6 ?6 v" r
- F% j: }3 G% d0 O5 }
6 W7 q8 Q/ k2 J6 t9 z' Y |