|
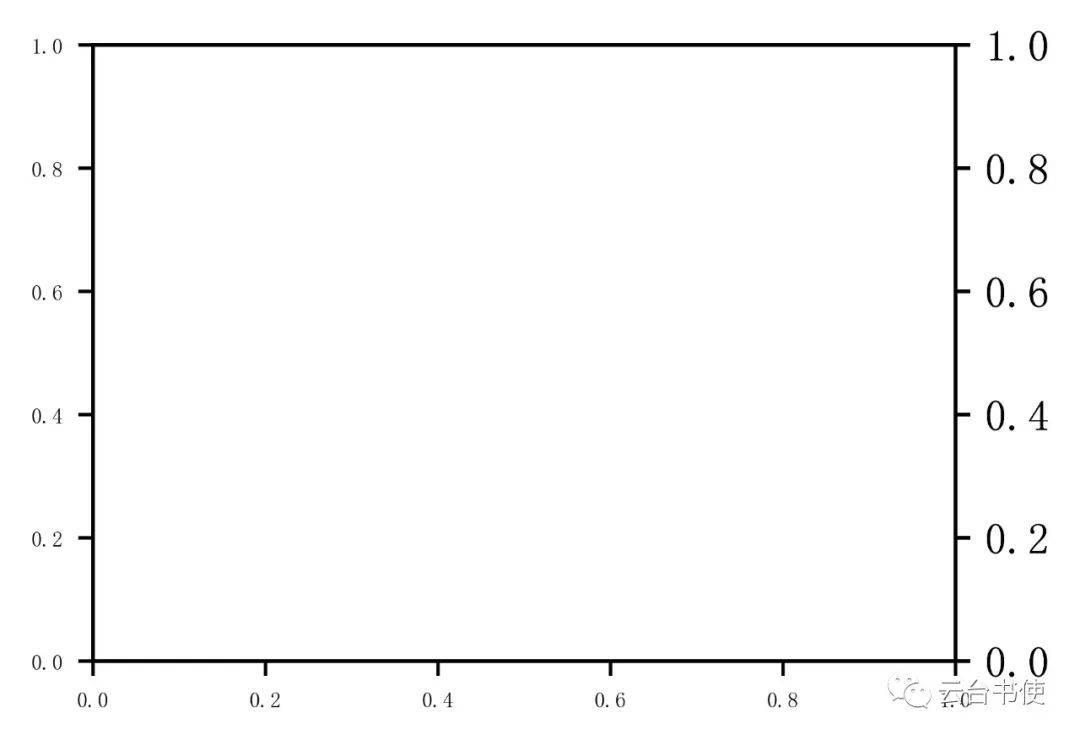
点击下方公众号,回复资料,收获惊喜 多y轴图是一种比较常用的气象复合信息表示图片类型。matplotlib中有多种添加y轴的方式。这里我们使用简单易懂的ax.twinx()的方式演示如何添加一张带有气温曲线、降水量柱、相对湿度曲线、风矢的复合信息图片。 在上述信息中,气温一般是-50~50℃,降水量一般是0-500mm,相对湿度0-100%,风矢0-50m/s,可见每个信息的量级与单位都不一样,不能共用一个y轴,所以需要多个y轴。 ax.twinx()是一个非常常用的复合y轴添加命令,而且不限制叠加次数(此点尤为重要)。于是我们首先新建一个ax,并添加三个y轴: [Python] 纯文本查看 复制代码
fig=plt.figure(figsize=(4,2),dpi=500)

ax1=fig.add_axes([0,0,0.7,1])

ax2=ax1.twinx()

ax3=ax1.twinx()

ax4=ax1.twinx()
8 y$ F3 V7 q# g6 c: f4 j9 {; J- [, h

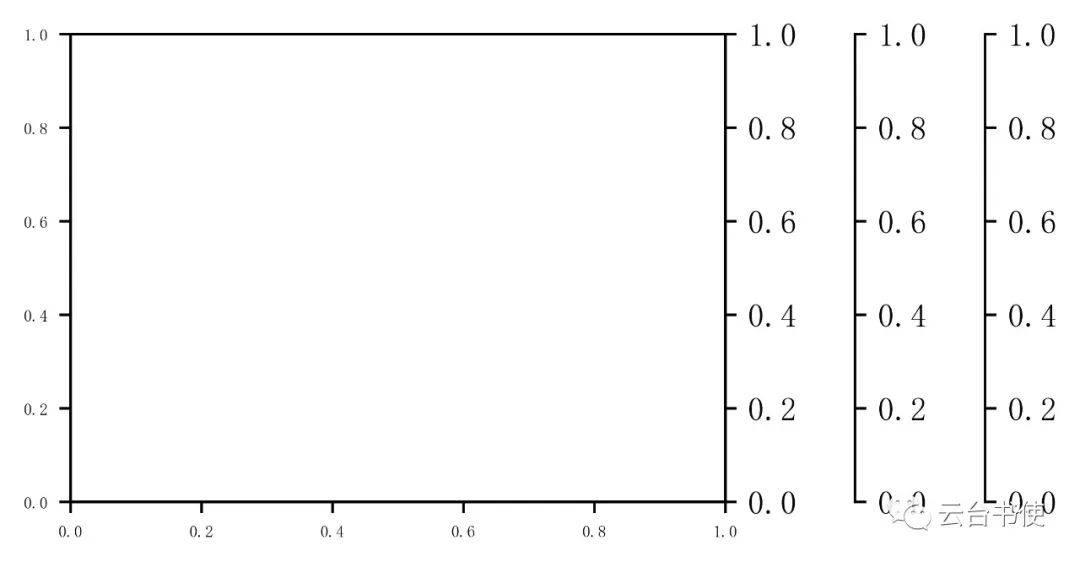
为什么只能看出两个y轴,这是因为右侧后面叠加的y轴互相遮盖,于是我们移动右侧y轴,平移到不同的距离: " q; ~, C( K$ g7 C- w& s
[Python] 纯文本查看 复制代码 ax3.spines['right'].set_position(('outward',40))
ax4.spines['right'].set_position(('outward',80))* t0 G3 b) Q" C9 D* Q

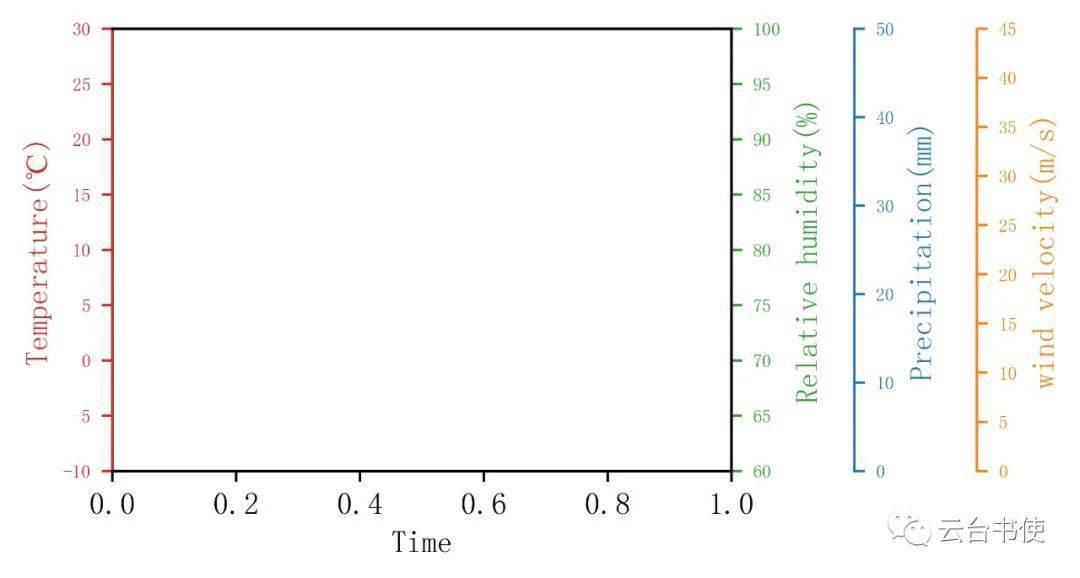
我们假定所有y轴从左至右分别为温度(红色)、相对湿度(绿色)、降雨量(蓝色)、风速的对应轴(黑色),x轴为时间轴(黑色),并添加相关信息。
! C! q" @2 y% e
& \, M" D5 l& C% j7 q& a9 D4 _
[Python] 纯文本查看 复制代码 ax1.set_xlabel('Time')
ax1.set_ylabel('Temperature(℃)',color='tab:red')
ax2.set_ylabel('Relative humidity(%)',color='tab:green')
ax3.set_ylabel('Precipitation(mm)',color='tab:blue')
ax4.set_ylabel('wind velocity(m/s)',color='tab:orange')
ax1.spines['left'].set_color('tab:red')
ax1.set_zorder(5)
ax1.set_ylim(-10,30)
ax1.patch.set_visible(False)
ax1.tick_params(axis='y',labelcolor='tab:red',color='tab:red',labelsize=6)
for ax,c in zip([ax2,ax3,ax4],['tab:green','tab:blue','tab:orange']):
ax.tick_params(labelcolor=c,color=c,labelsize=6)
ax.spines['right'].set_color(c)
ax2.set_ylim(60,100)
ax3.set_ylim(0,50)
ax4.set_ylim(0,45)
x=np.arange(0,10,1)

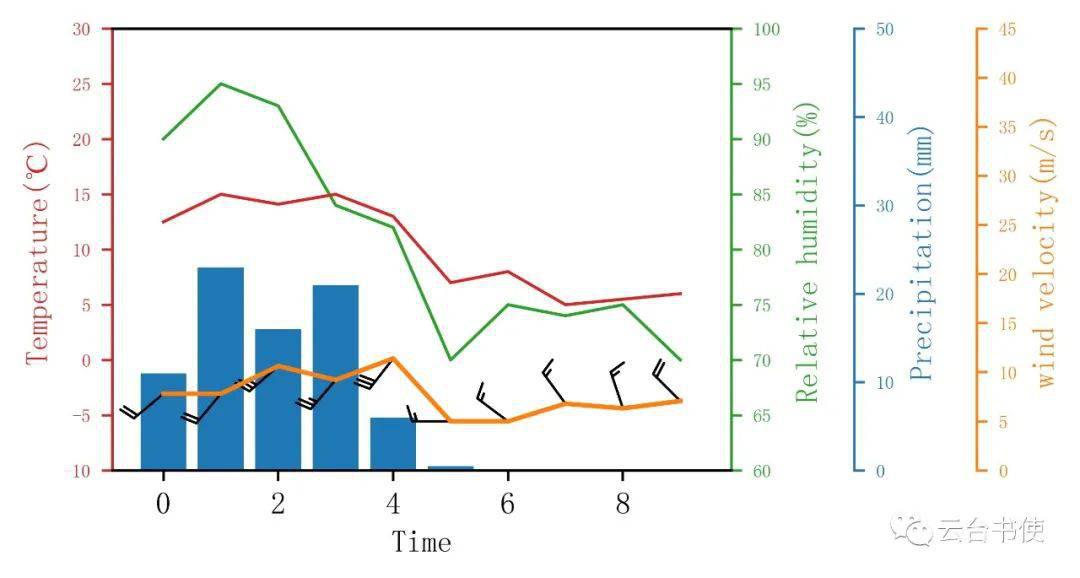
随后,按照各种数据进行绘图。 7 n: g: ?7 A5 c; Y
[Python] 纯文本查看 复制代码 x=np.arange(0,10,1)
temp=np.array([12.5,15,14.1,15,13,7,8,5,5.5,6])
rain=np.array([11,23,16,21,6,0.5,0,0,0,0])
rh=np.array([90,95,93,84,82,70,75,74,75,70])
u=np.array([6,5,8,6,7,5,4,4,2,5])
v=np.array([5,6,7,7,9,0,-3,-5.5,-6,-5])
ax1.plot(x,temp,c='tab:red',lw=1)
ax2.plot(x,rh,c='tab:green',lw=1)
ax3.bar(x,rain,color='tab:blue')
ax4.barbs(x,
np.sqrt(u**2+v**2),
u,
v,
barb_increments={'half':2,'full':4,'flag':20},length=5,color='k',
lw=0.75)
ax4.plot(x,np.sqrt(u**2+v**2),c='tab:orange',lw=1.5)
0 ^' g4 ^; s' d: t& i; c3 q6 L Y8 c- n4 H
; d+ G$ s: L9 v% S$ P. V0 b) c# z3 v
) G& p6 C- q0 ?' b

这样,就能实现多个y轴的绘制,与ParasiteAxes绘制的方式相比,这种更容易理解操作,无外乎twinx加上平移轴。 完整程序段: [Python] 纯文本查看 复制代码
import numpy as np
import matplotlib.pyplot as plt
import matplotlib.spines as sp
import matplotlib.path as mpath
plt.rcParams['font.sans-serif']=['FangSong']
plt.rcParams['axes.unicode_minus']=False
fig=plt.figure(figsize=(4,2),dpi=500)
ax1=fig.add_axes([0,0,0.7,1])
ax2=ax1.twinx()
ax3=ax1.twinx()
ax4=ax1.twinx()
ax3.spines['right'].set_position(('outward',40))

ax4.spines['right'].set_position(('outward',80))
ax1.set_xlabel('Time')
ax1.set_ylabel('Temperature(℃)',color='tab:red')
ax2.set_ylabel('Relative humidity(%)',color='tab:green')
ax3.set_ylabel('Precipitation(mm)',color='tab:blue')
ax4.set_ylabel('wind velocity(m/s)',color='tab:orange')
ax1.spines['left'].set_color('tab:red')
ax1.set_zorder(5)
ax1.set_ylim(-10,30)
ax1.patch.set_visible(False)
ax1.tick_params(axis='y',labelcolor='tab:red',color='tab:red',labelsize=6)
ax1.spines['right'].set_color('tab:green')
for ax,c in zip([ax2,ax3,ax4],['tab:green','tab:blue','tab:orange']):
ax.tick_params(labelcolor=c,color=c,labelsize=6)
ax.spines['right'].set_color(c)
ax2.set_ylim(60,100)
ax3.set_ylim(0,50)
ax4.set_ylim(0,45)
x=np.arange(0,10,1)

temp=np.array([12.5,15,14.1,15,13,7,8,5,5.5,6])

rain=np.array([11,23,16,21,6,0.5,0,0,0,0])

rh=np.array([90,95,93,84,82,70,75,74,75,70])

u=np.array([6,5,8,6,7,5,4,4,2,5])

v=np.array([5,6,7,7,9,0,-3,-5.5,-6,-5])

ax1.plot(x,temp,c='tab:red',lw=1)

ax2.plot(x,rh,c='tab:green',lw=1)

ax3.bar(x,rain,color='tab:blue')

ax4.barbs(x,

          np.sqrt(u**2+v**2),

          u,

          v,

          barb_increments={'half':2,'full':4,'flag':20},length=5,color='k',

          lw=0.75)

ax4.plot(x,np.sqrt(u**2+v**2),c='tab:orange',lw=1.5)
plt.show()3 [ s! H! t' r( y
! R6 m F" d2 X0 H) @# K
|


