|
介绍 这几年一直很火的就是碳排放,那么关于碳数据的检测就比较重要,可能一些同学对这部分数据比较感兴趣,想要收集。 这里介绍一个网站,网站里面有一些主要国家的碳数据,涉及到的行业有:'全国', '电力', '地面运输', '工业', '居民消费', '国内航空'等。 网站链接:www.52ocean.cn 网站截图:

这里再附上几张主要截图(地区为全球,时间只显示了2020、2021年):
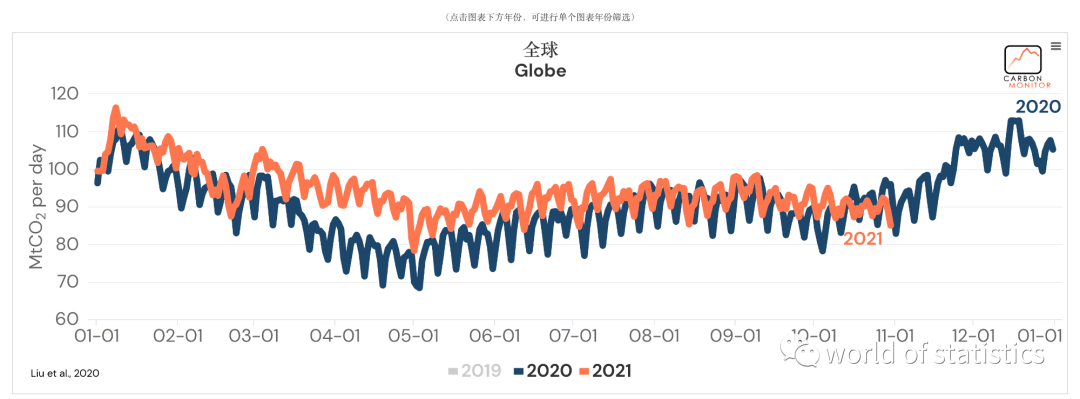
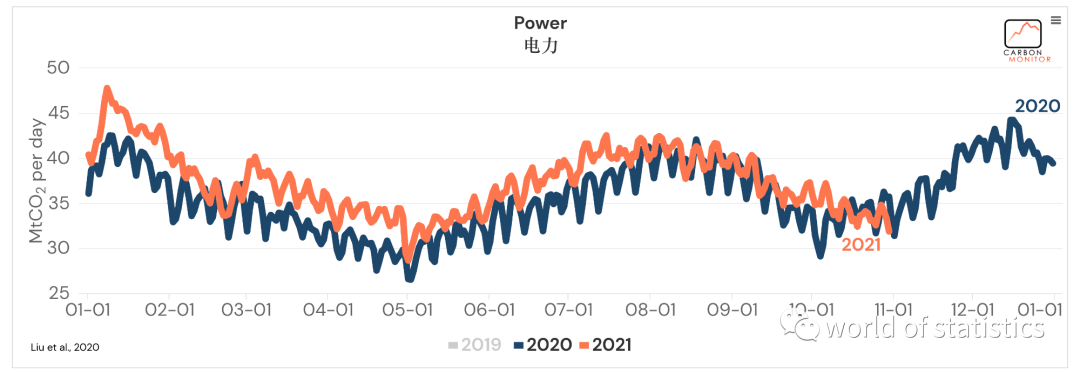
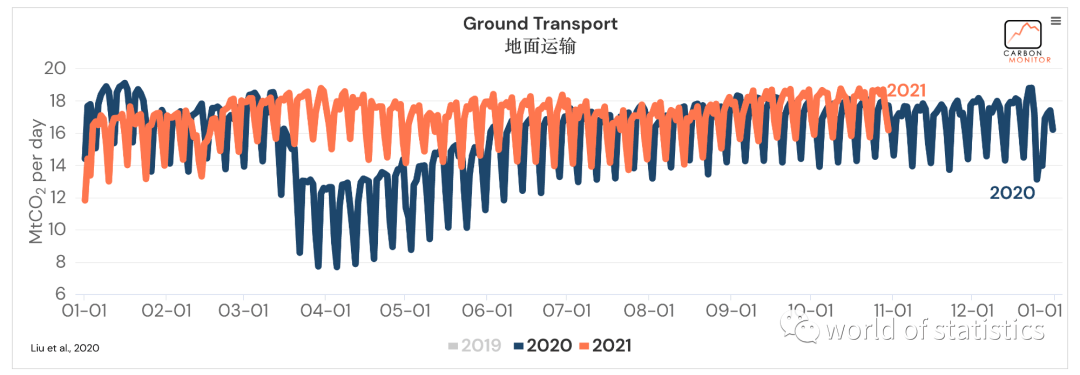
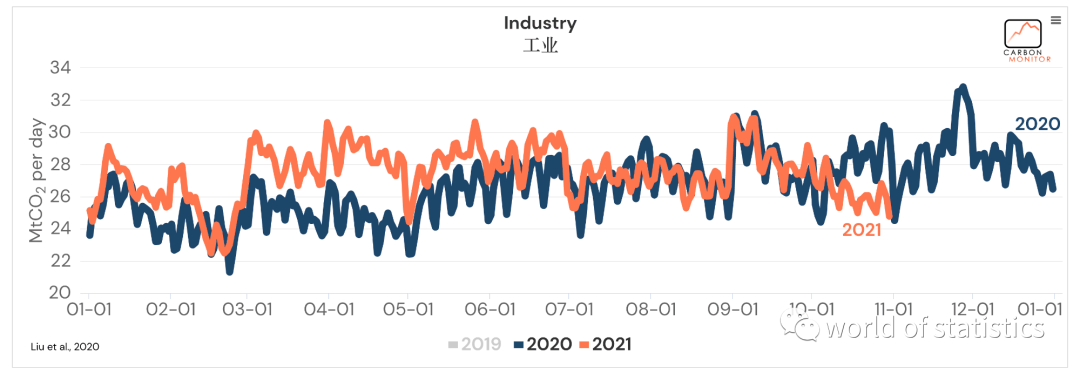
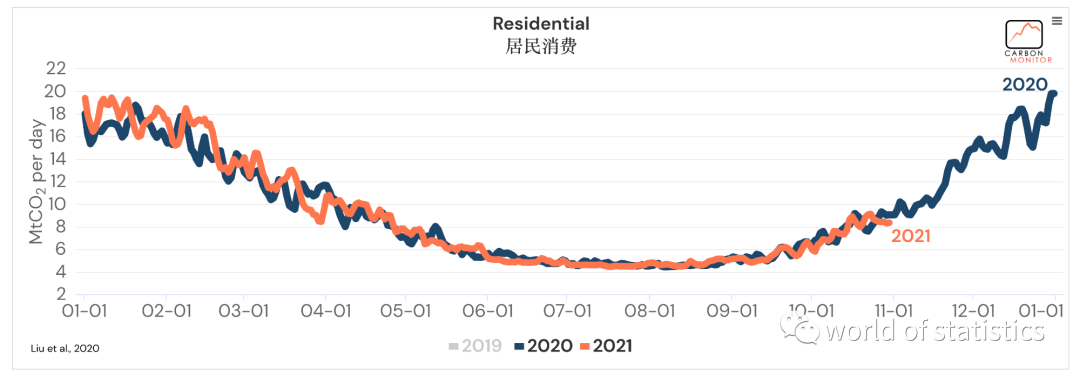
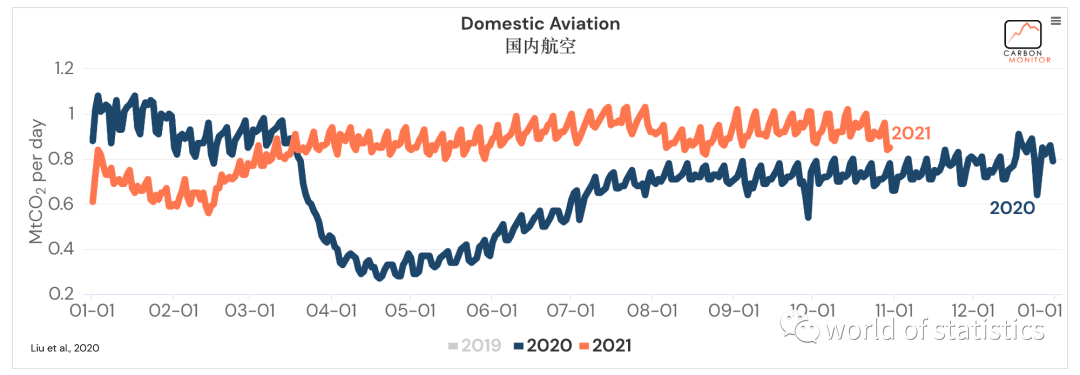
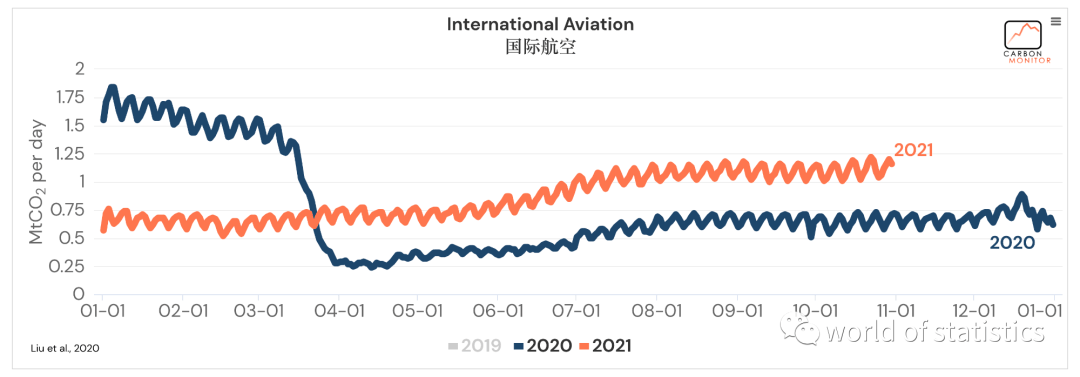
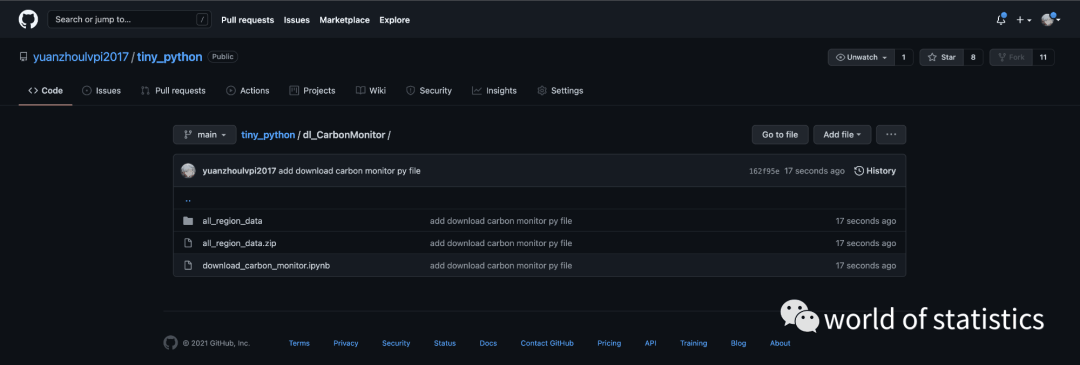
整体来说,可以发现数据还是相当丰富的。看着就让人心动,那么我们就把这些数据爬下来吧。 爬虫思路找到数据位置我把这个网站的整个数据请求链接看了好几遍,我以为数据是异步加载的,导致我翻来覆去的阅读那些js文件,但是都没找到数据异步加载的链接。我还以为是把js代码混淆加密了,结果花了好多时间去阅读js源码。 所有的办法都是尝试了一边之后,我回过头重新查看网页的主体,才发现,原来,最重要的东西都在html里面的script里面。就是数据直接写在html文件里面。我也是第一次见,数据不是异步加载,而是写到html里面 提取数据既然已经知道数据就是在html的script脚本里面,那么我们就是把script部分的js代码提取出来就可以了。 我刚开始的思路就是,使用python的js2py或者V8eval包对js脚本做运行,然后提取里面的数据。但是两个都都失败了, 最终的解决办法:我使用正则方法把数据给解析出来了,解析出:时间、类别、数据。然后后面又做了一些简单的数据处理,最终输出一个非常清晰的数据框。 代码我这个代码非常简单,基本上只要使用使用的Anaconda环境,大家都不需要安装别的包了。我已经将代码放到我的GIthub上面了:https://github.com/yuanzhoulvpi2017/tiny_python/tree/main/dl_CarbonMonitor 并且也于2021-12-9日下载了一份数据放在文件夹下,截图如下:(我也额外写了一个小代码,直接下载所有地区的数据)
这里也贴一份代码: 基本脚本[Python] 纯文本查看 复制代码 importrequests
frombs4 importBeautifulSoup
fromitertools importchain
importre
importpandas aspd
importdatetime
defget_carbon_data(by='China'):
"""
by: 输入对应的区域,具体的可以参考这个网站
[url]https://carbonmonitor.org.cn/user/data.php?by=WORLD[/url]
:return 返回数据框
"""
location_list = ['WORLD', 'China', 'India', 'US', 'EU27', 'Russia', 'Japan',
'Brazil', 'UK', 'France', 'Italy', 'Germany', 'Spain', 'ROW']
ifby notinlocation_list:
raiseValueError(f"你输入的 by 参数应该在这个列表内: {' ,'.join(location_list)}")
web = requests.get(url=f"https://carbonmonitor.org.cn/user/data.php?by={by}")
soup = BeautifulSoup(web.content, 'lxml')
target_str = soup.find_all(name='script', attrs={'type': 'text/javascript'})[-2].string
all_year = re.findall(pattern='''\"name\"\:(\w+)''', string=target_str)
all_value = re.findall(pattern='''\"data\"\:\[(.*?)\]''', string=target_str)
# type_list = ['全国', '电力', '地面运输', '工业', '居民消费', '国内航空']
type_list = re.findall(pattern='''text\:(.*?)\<br \/\>(.*?)''', string=target_str)
type_list = [''.join(i).replace("'", "").replace('"', "").lstrip() fori intype_list]
type_list = list(chain(*[[i] * len(set(all_year)) fori intype_list]))
# print(type_list)
defgenerate_pd(i):
temp_data = pd.DataFrame({'value': [float(i) fori inall_value[i].split(',')]})
# temp_data['year'] = int(all_year[i])
temp_data['type'] = type_list[i]
temp_data['date'] = [datetime.date(year=int(all_year[i]), month=1, day=1) + datetime.timedelta(days=index) for
index inrange(0, temp_data.shape[0])]
returntemp_data
allresult = pd.concat([generate_pd(i) fori inrange(0, len(all_value))])
allresult = allresult.pivot_table(index=['date'], columns=['type'])
allresult.columns = [i[1] fori inallresult.columns.tolist()]
allresult = allresult.reset_index()
returnallresult
运行单块上面的代码,只是提取单个地区的数据:
- }! R4 ~- F+ o: i# J8 N[Python] 纯文本查看 复制代码 # 使用脚本
get_carbon_data(by='WORLD')


批量下载脚本因为有些人喜欢批量下载所有数据,我这里为大家也写了一个简单的下载脚本。 [Python] 纯文本查看 复制代码 importos
importshutil
importtime
importrandom
fromtqdm importtqdm
dir_name = "all_region_data"
ifos.path.exists(path=dir_name):
shutil.rmtree(path=dir_name)
os.makedirs(name=dir_name)
else:
os.makedirs(name=dir_name)
region_list = ['WORLD', 'China', 'India', 'US', 'EU27', 'Russia', 'Japan',
'Brazil', 'UK', 'France', 'Italy', 'Germany', 'Spain', 'ROW']
fortemp_reion intqdm(region_list):
time.sleep(random.random(0, 4))
tempdata = get_carbon_data(by=temp_reion)
tempdata.to_csv(f"{dir_name}/{temp_reion}.csv", index=False)
0 V/ Q0 A {! s" @写在后面感觉这个网站并不是实时更新的,可能是定期更新。 如果脚本失效了,可以找我联系(微信联系方式,就在公众号world of statistics的菜单栏的右下角),我再继续更新代码。 公众号文章的代码可能后期就失效了,大家可以去我的仓库查看最新的代码和注意事项:https://github.com/yuanzhoulvpi2017/tiny_python/tree/main/dl_CarbonMonitor 6 r- {. C; _' p+ l% c
9 h; `$ P" w# L" N7 {* a
| 

